Valuing defense,
reproduced
A from-scratch rebuild of the research paper “Better Prevent than Tackle” (Kim et al.). It uses AI to measure something normal soccer stats miss: how much a defender is worth for the danger they quietly shut down, not just the tackles they make.
The scoreboard
Seven small AI models, each scored on match data it never trained on, and ranked by how close I got to the paper (my score ÷ the paper's score). Most learn from one match and get tested on another. A few handle rare moments like blocks and interceptions; those I retrained on 7 games from the 2022 World Cup (marked +PFF below). The paper had 564 matches to learn from and I have a handful, so this is really a test of whether my gaps came down to having less data rather than a worse method. (The “How close” column is my score divided by the paper’s: 1.00 means I matched it exactly, above 1.00 means I beat it, and below means I came up short. AUC and MRR are just accuracy-style scores: higher is better, and 1.0 is perfect.)
| # | Model | Score type | Mine | Paper | How close | Status |
|---|---|---|---|---|---|---|
| 1 | c1 · Scoring soon chance the attacking team scores · GAT |
AUC | 0.749 | ~0.68 | 1.10 |
matched the paper |
| 2 | c3 · Shot quality chance an unblocked shot scores · logistic |
AUC | 0.785 | 0.775 | 1.01 |
matched the paper |
| 3 | b2 · Shot blocked chance a defender blocks the shot · GAT · +PFF |
AUC | 0.672 | 0.672 | 1.00 |
matched the paper |
| 4 | b1 · Pass completed chance the pass reaches a teammate · GAT |
AUC | 0.823 | 0.917 | 0.90 |
matched the paper |
| 5 | a1 · Next action pass, dribble, or shoot · GAT |
MRR | 0.670 | 0.800 | 0.84 |
beat the simple version |
| 6 | d1 · Ball won back which defender makes the stop · GAT · +PFF |
MRR | 0.436 | 0.694 | 0.63 |
getting closer |
| 7 | c2 · Conceding soon chance the defending team concedes · GAT · +PFF |
AUC | 0.48 | ~0.62 | n/a |
needs more data |
How close I got
Every model's score plotted against the paper's. Land on the dashed line and I matched it exactly; above the line I did better, below it I fell short. Where I fell short, the problem is usually too little data, not a broken method, and I checked that directly: retraining the three hardest models on 7 World Cup games put b2 right on the line and nearly doubled d1 (0.272 to 0.436). Only c2 (predicting goals conceded, which happens in barely 1% of moments) still needs far more data to work.
Which method wins
The paper tried several AI methods and said its fanciest one (called GAT, an “attention” network) came out on top. On the two public matches I could test, it didn't. Simpler methods matched or beat it. The likely reason: the fancy method only pays off with far more data than I have. Best score in each row is in blue.
| Task | Score type | GAT | GCN | GIN | XGBoost | CatBoost |
|---|---|---|---|---|---|---|
| b1 · Pass completed | AUC ↑ | 0.823 | 0.880 | 0.701 | 0.869 | 0.862 |
| a1 · Next action | MRR ↑ | 0.670 | 0.694 | 0.278 | n/a | n/a |
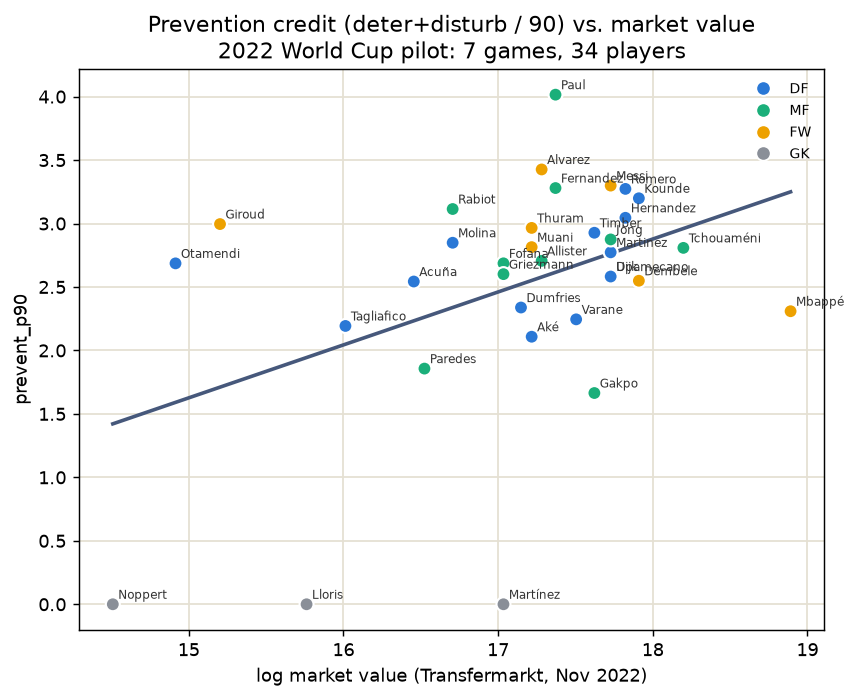
I took 7 knockout games from the 2022 World Cup, looked at 34 defenders, and paired each one with their market value (roughly what a club would pay for them, from Transfermarkt in November 2022). The question: what kind of defending does the transfer market actually pay for? I compared two different skills against each player’s value.
In short, the market pays defenders for where they stand, not for how often they tackle. That is exactly the paper’s main claim. (r just measures how strongly two things move together: 0 means no link, and +1 means they rise in perfect step.)
Treat this as a hint, not proof. The models were trained on a different data source, so the exact numbers are rough, and 34 players over 7 games is tiny next to the paper’s 564 matches. The flip side of the claim, that letting danger through should count against a defender, did not show up cleanly with this little data.
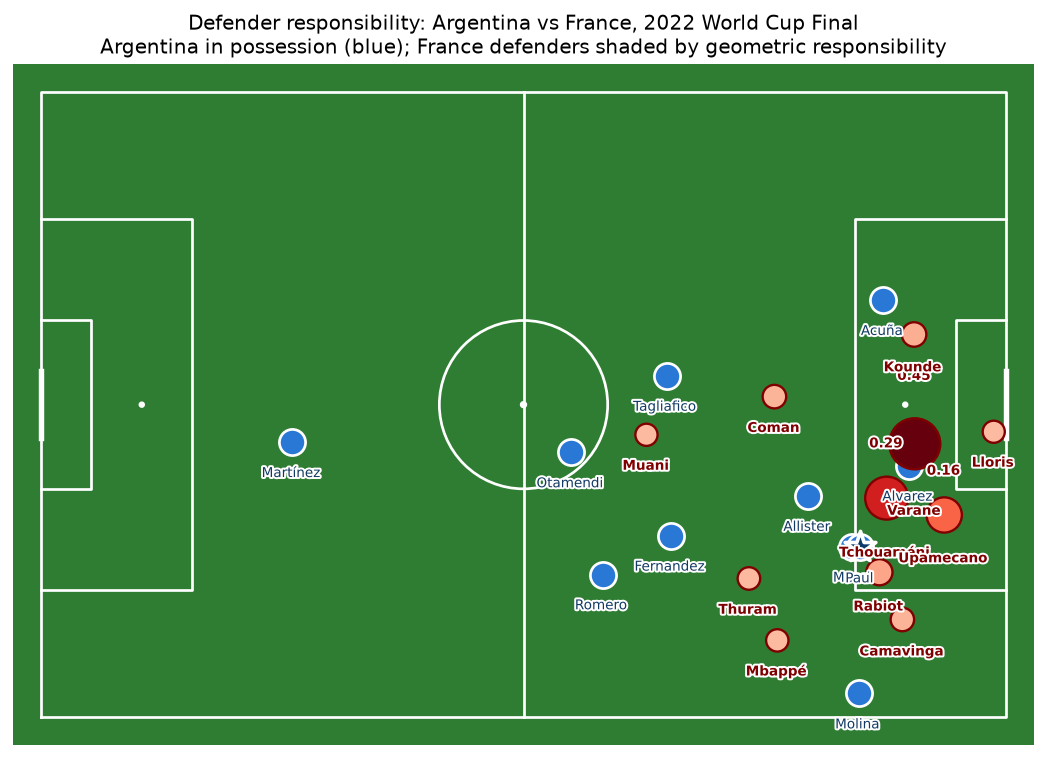
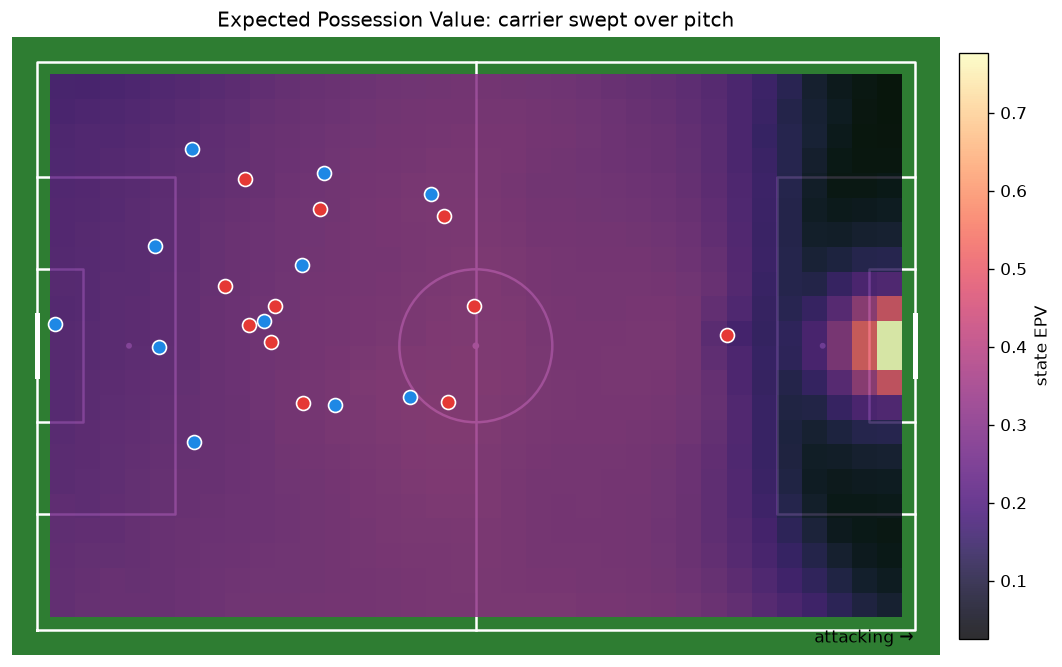
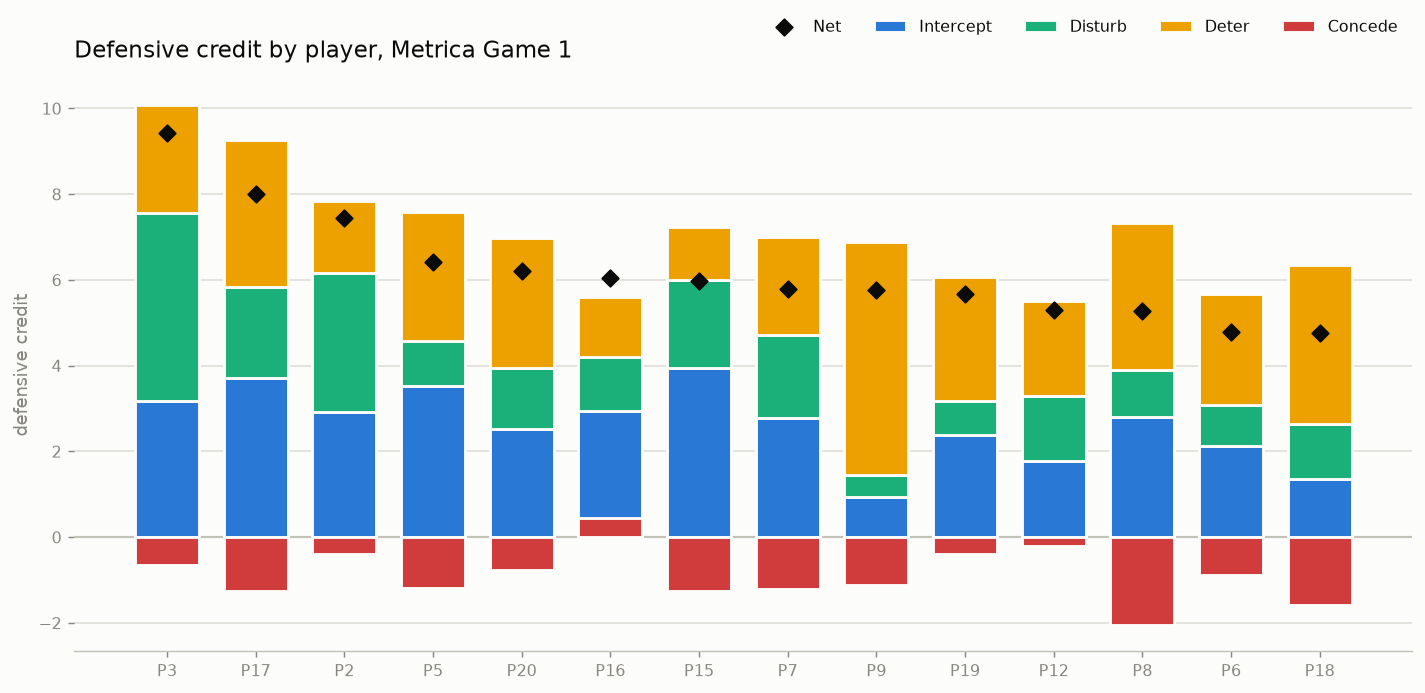
Pictures from the code
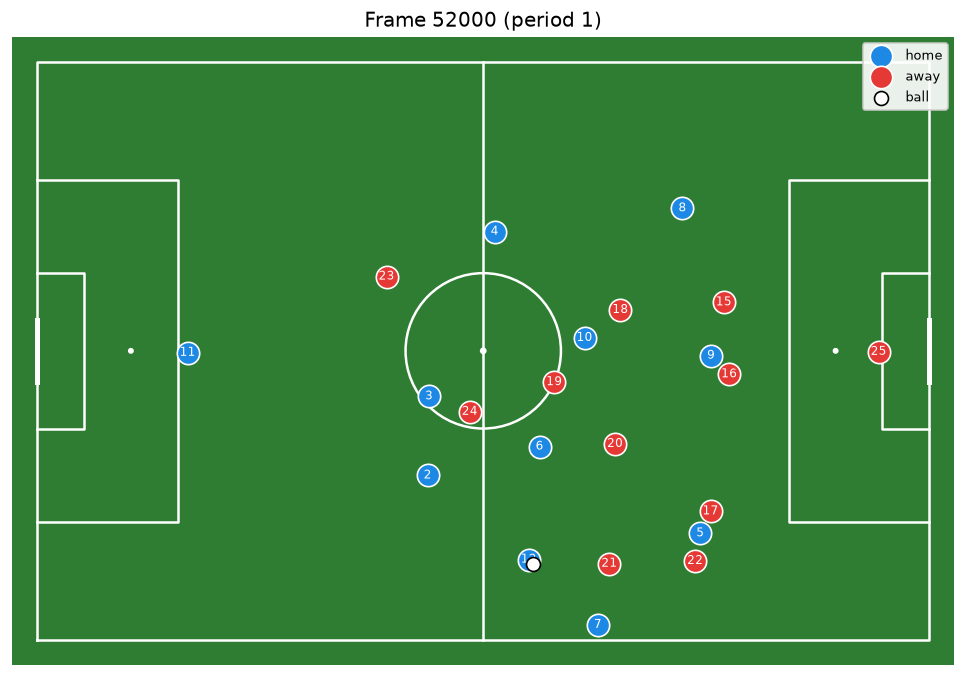
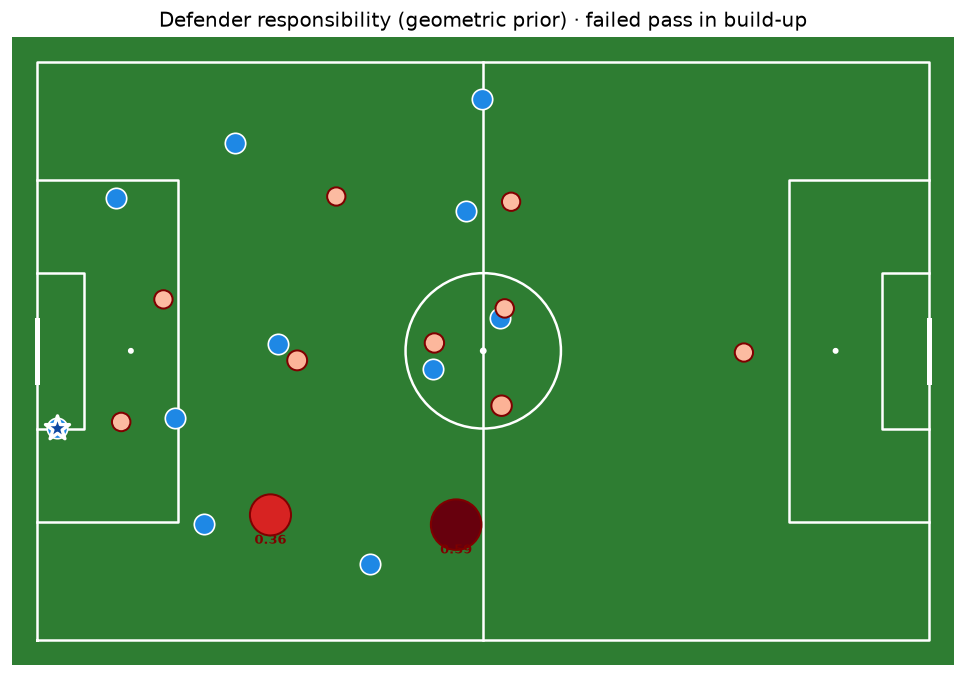
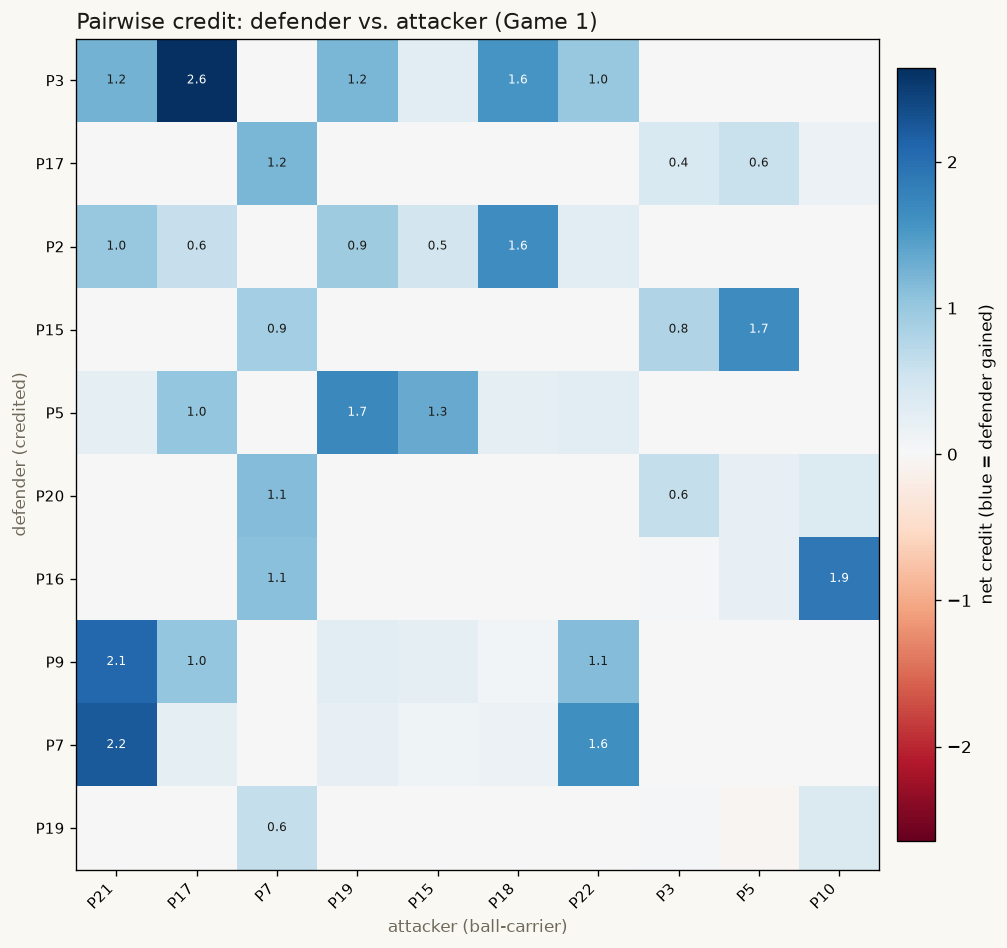
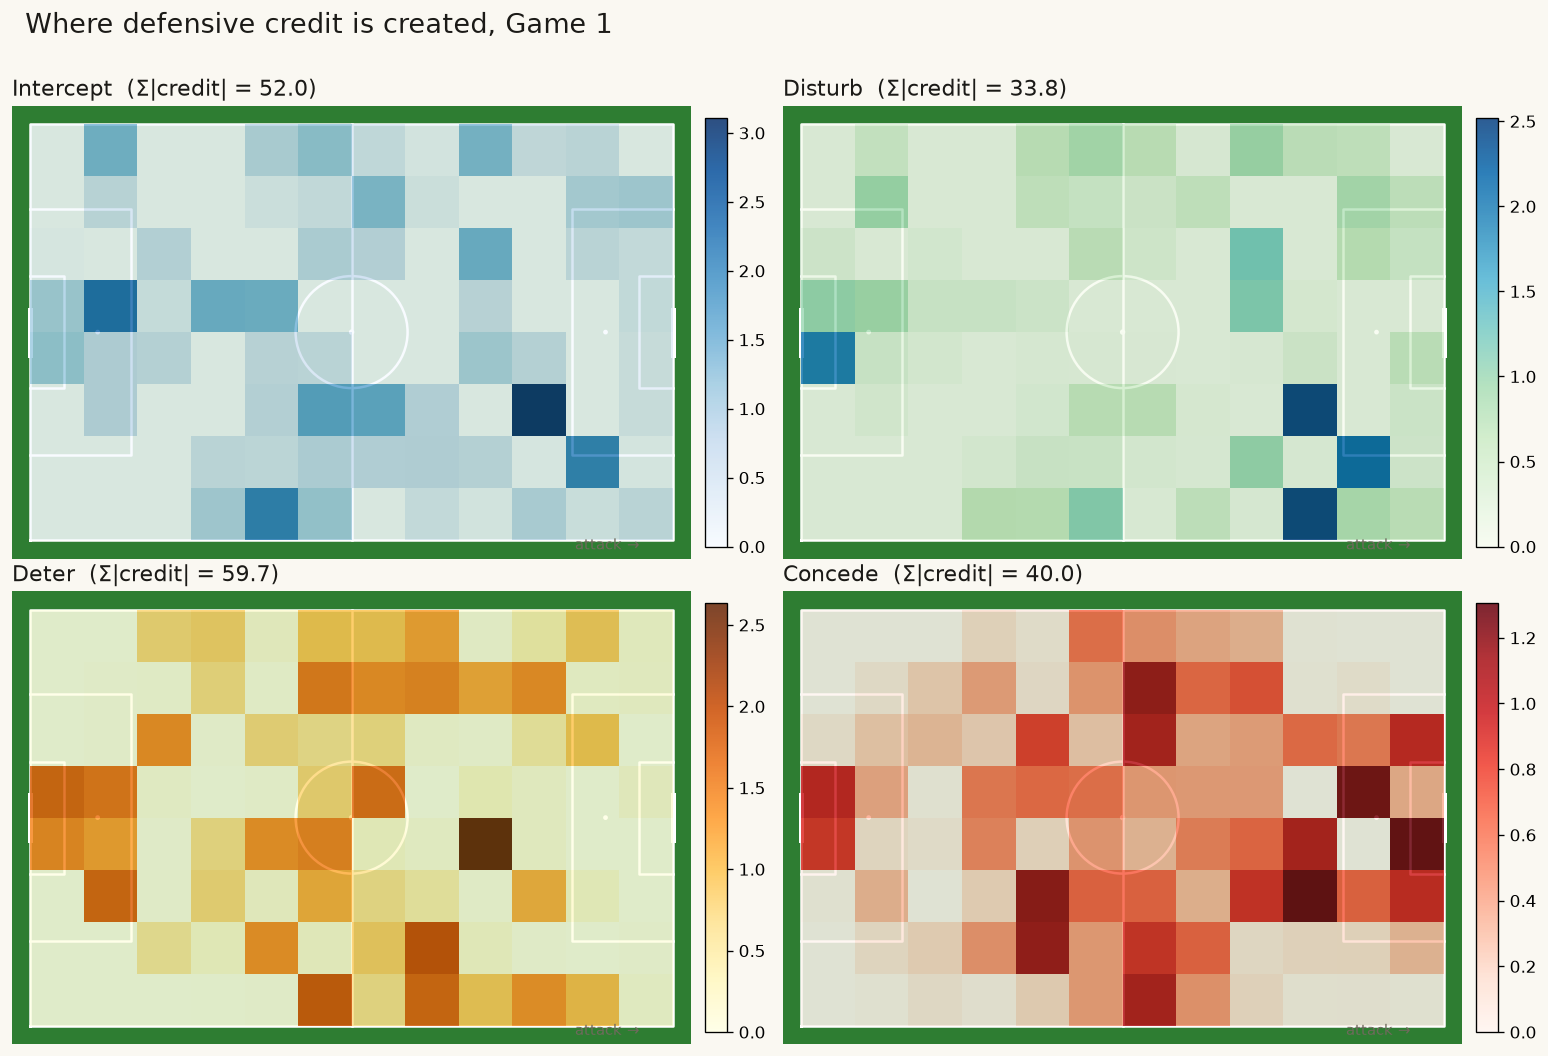
Every image here is made by the actual code, running on real match data.